Visual media are increasingly generated, manipulated, and transmitted by computers. When well designed, such displays capitalize on human facilities for processing visual information and thereby improve comprehension, memory, inference, and decision making. Yet the digital tools for transforming data into visualizations still require low-level interaction by skilled human designers. As a result, producing effective visualizations can take hours or days and consume considerable human effort.
In this course we will study techniques and algorithms for creating effective visualizations based on principles and techniques from graphic design, visual art, perceptual psychology and cognitive science. The course is targeted both towards students interested in using visualization in their own work, as well as students interested in building better visualization tools and systems. In addition to participating in class discussions, students will have to complete several short programming and data analysis assignments as well as a final programming project.
There are no official prerequisites for the class, but the class is aimed at graduate students and advanced undergraduates. However, familiarity with the material in CS147, CS 148 and CS142 can be useful. Even more important is a basic working knowledge of web-programming, especially Javascript and D3. Experience with data analysis applications (e.g. Excel, Matlab, R) is also helpful. The final project can be developed using any suitable language or application. While we will cover a little bit of Javascript/D3 in class, most of the other APIs, applications and languages will not be taught in the course. However many introductory tutorials at the level required for the class are available on the web and we can help you find the relevant information as you need it.
Contact me (Maneesh) via Piazza if you are worried about whether you have the background for the course.
Schedule
Chapter 1: Graphical Excellence, In The Visual Display of Quantitative Information. Tufte.
Chapter 2: Graphical Integrity, In The Visual Display of Quantitative Information. Tufte.
Decision to launch the Challenger, In Visual Explanations. Tufte. (pdf)
Representation and Misrepresentation. (Critique of Tufte's analysis). Boisjoly et al. (web)
Graphs in Statistical Analysis. F. J. Anscombe. The American Statistician. (jstor)
Chapter 1: Information Visualization, In Readings in Information Visualization. Card, et al. (pdf)
Chapter 2: Graphical Integrity, In The Visual Display of Quantitative Information. Tufte.
Chapter 3: Sources of Graphical Integrity. In VDQI. Tufte.
Chapter 4: Data-Ink and Graphical Redesign. In VDQI. Tufte.
Chapter 5: Chartjunk. In VDQI. Tufte.
Chapter 6: Data Ink Maximization and Graphical Design. In VDQI. Tufte.
Polaris. Stolte, Tang, and Hanrahan. IEEE TVCG, 8(1), Jan 2002. (pdf)
Chapter 2: Macro/Micro Readings. In Enviinsioning Information. Tufte.
Chapter 8: Data Density and Small Multiples. In VDQI. Tufte.
Chapter 4: Small Multiples. In Envisioning Information. Tufte.
Dynamic queries, starfield displays, and the path to Spotfire. Shneiderman. (web)
Exploratory Data Analysis. NIST Engineering Statistics Handbook. (web)
Exploratory Data Analysis. Wikipedia. (wikipedia)
Perception in visualization. Healey. (html)
Graphical perception. Cleveland and McGill. (jstor)
Chapter 3: Layering and Separation. In Envisioning Information. Tufte.
Gestalt and composition. In Course #13, SIGGRAPH 2002. Durand. (pdf)
The psychophysics of sensory function. Stevens. (jstor)
Crowdsourcing Graphical Perception. Heer and Bostock. ACM CHI 2010. (pdf)
Postmortem of an example, Bertin. (pdf)
Visual information seeking, Ahlberg and Shneiderman. (html)
Visual queries for finding patterns in time series data, Hochheiser and Schneiderman. (pdf)
Generalized selection via interactive query relaxation. Heer, Agrawala & Willett. (html)
The visual design and control of the trellis display. Becker, Cleveland and Shyu. (pdf)
Exploration of the Brain’s White Matter Pathways with Dynamic Queries. Akers et al. (html)
ggobi
Homefinder
Cellphones
zipdecode
NameVoyager
LA Homicides
Classic systems from stat-graphics.org
D3: Data Driven Documents. Bostock et al. (html)
D3 documentation (html)
D3 bar chart tutorial (html)
Work through Scott Murray's D3 tutorials (html)
Software Design Patterns for Information Visualization. Heer and Agrawala (html)
Protovis: A Graphical Toolkit for Visualization. Bostock and Heer. (pdf)
prefuse: A Toolkit for Interactive Information Visualization. Heer, Card and Landay. (html)
Visual exploration of time-series data, Hochheiser and Schneiderman. (pdf)
Interactive Data Visualization for the Web. 2nd Ed., Scott Murray. Chapters 4, 5, 6. (html)
Eloquent Javascript, Marijn Haverbeke. Chapter 16. (html)
Interactive Data Visualization for the Web. 2nd Ed. Scott Murray. Chapters 7, 8, 9. (html)
jQuery Enlightenment, Cody Lindley. Chapters 1, 2, 6. (pdf)
Dive Into HTML5, Mark Pilgrim. Chapter 4. (html)
Generalized selection via interactive query relaxation. Heer, Agrawala & Willett. (html)
The visual design and control of the trellis display. Becker, Cleveland and Shyu. (pdf)
Exploration of the Brain’s White Matter Pathways with Dynamic Queries. Akers et al. (html)
ggobi
Homefinder
Cellphones
zipdecode
NameVoyager
LA Homicides
Classic systems from stat-graphics.org
Graphical Methods for Data Presentation. Cleveland. (jstor)
Chapter 11: The Cartogram: Value-by-Area Mapping. In Cartography. Dent. (pdf)
Multi-Scale Banking to 45 Degrees. Heer and Agrawala. (pdf)
An Empirical Model of Slope Ratio Comparisons. Talbot et al. (html)
Pad++, Bederson and Hollan (acm)
Generalized fisheye views, Furnas. (acm)
Hyperdimensional data analysis using parallel coordinates, Wegman. (jstor)
A framework for unifying presentation space, Carpendale and Montagnese. (acm)
Nomography (html)
Cartogram Central (html)
The Pudding (read through at least 3 articles in detail) (html)
Design for an Audience, Corum. (html)
Narrative Visualization: Telling Stories with Data, Segel and Heer. (pdf)
Revision: Automated Classification, Analysis and Redesign of Chart Images.Savva et al. (html)
Graphical Overlays: Using Layered Elements to Aid Chart Reading. Kong and Agrawala. (html)
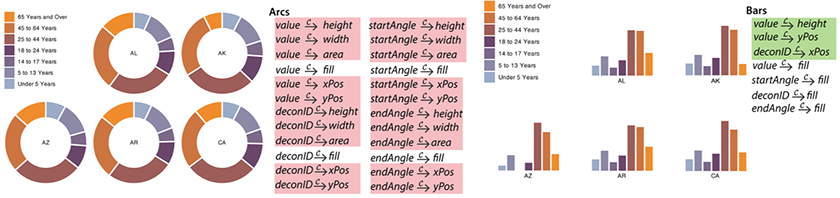
Deconstructing and Restyling D3 Visualizations. Harper and Agrawala (html)
Extracting References Between Text and Charts via Crowdsourcing. Kong et al. (html)
Color and information, In Envisioning Information, Tufte.
Color Naming Models for Color Selection, Image Editing and Palette Design. Heer and Stone. (html)
Color guidelines, Brewer. (html)
The crayola-fication of the world. Bhatia. (html)
A rule-based system for assisting color map selection, Bergman, Treinish and Rogowitz. (pdf)
Charting color from the eye of the beholder. Landa, Fairchild. (pdf)
Color2Gray: Salience-preserving color removal. Gooch, Olsen, Tumblin, Gooch. (pdf)
ColorBrewer2
Bruce Lindbloom’s Useful color information, studies, and files
Meet iCam: A Next-Generation Color Appearance Model
• Alison Chen, Carmelle Millar, Sydney Hutton
• Travis Chen, Michelle Lam, Lucy Wang
• Garrick Fernandez
• James Hong
• Chris Yoon, Karen Huynh, Kashif Nazir
• Darby Schumacher, Ian Jones
• Sidra Ijaz, Rebecca Lane
• Chenchen Pan, Flora Wang
• Allison Park
• Claire Shu
• Junwon Park, Alexa Siu
• Pin Pin Tea-mangkornpan
• Stephanie Wang
• Angelica Willis, Matthew Ventures
• Yinchen Xu
• Jia Yao, Jiaxi Chen, Ziran Zhang
• Chun Wang, Kexin Yu
• Jessica Zhao
Graph Visualization: A Survey. Herman, Melancon and Marshall. (pdf)
Hierarchical Edge Bundles. Holten. (ieee)
Let’s draw a graph. Khoury. (html)
Visual Exploration of Multivariate Graphs. Wattenberg. (pdf)
Improving Walker’s Algorithm to Run in Linear Time. Buchheim, Jünger and Leipert. (pdf)
Dig-cola. Dwyer and Koren. (pdf)
A Technique for Drawing Directed Graphs. Gansner, Koutsofios, North and Vo. (pdf)
Centrality and Prestige of Social Network Analysis. (pp. 169-198) Wasserman and Faust. (pdf)
Balancing Systematic and Flexible Exploration of Social Networks. Perrer and Shneiderman. (pdf)
The Structure and Function of Complex Networks (Sections 1 and 2 only pp. 1-8). Newman. (pdf)
The Social Organization of Conspiracy. Baker and Faulkner. (pdf)
Animated Transitions in Statistical Data Graphics. Heer and Robertson. (html)
The Value of Visualization. Van Wijk. (pdf)
Animation: Can it facilitate? Tversky, Morrison and Betrancourt. (pdf)
Visualization Research Challenges. NIH/NSF Research Report. Johnson et. al. (pdf)
Principles of Traditional Animation Applied to Computer Animation. Lasseter. (acm)
Intuitive Physics. McCloskey. (pdf)
Representing motion in a static image. Cutting. (pdf)
Textbooks
- The Visual Display of Quantitative Information (2nd Edition). E. Tufte. Graphics Press.
- Envisioning Information. E. Tufte. Graphics Press.
Your best bet is to order them online.
Please order soon. Readings will be assigned in the first week of class.
Teaching Staff
Instructor: Maneesh Agrawala
Office Hours: 10-11a Mondays, Gates 364 and by appointment
Course Assistant: Gracie Young
Office Hours: 9:30-10:30a Tuesdays, Lathrop Tech. Lounge and by appointment
Course Assistant: Vera Lin
Office Hours: 4:30-5:30p Thursdays, Huang Basement and by appointment
To contact us please use Piazza. This is the fastest way to get a response.
Assignments and Requirements
Class Participation (10%)
Assignment 1: Visualization Design (10%)
Assignment 2: Exploratory Data Analysis (15%)
Assignment 3: Creating Interactive Visualization Software (25%)
Final Project (40%)
Late Policy: For assignments we will deduct 10% for each day (including weekends) the assignment is late.
Plagiarism Policy: Assignments should consist primarily of your original work, building off of others’ work–including 3rd party libraries, public source code examples, and design ideas–is acceptable and in most cases encouraged. However, failure to cite such sources will result in score deductions proportional to the severity of the oversight.