Assignment 3: Creating Interactive Visualization Software
Due: Monday Oct 30, 2023 by 11:30am
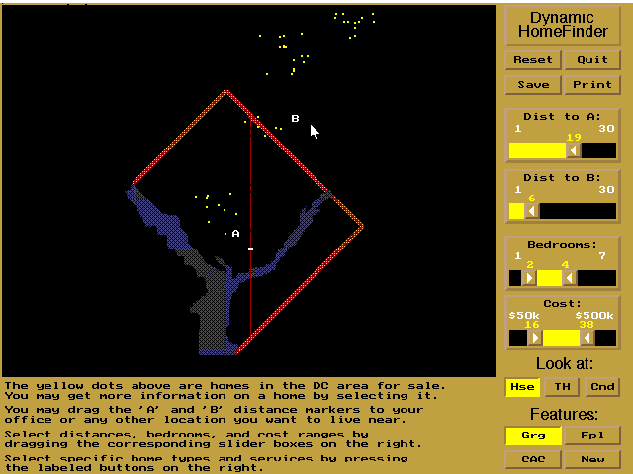
In this assignment, you will explore the issues involved in implementing interactive visualization software. Specifically we would like you to implement the interactive technique of dynamic queries – first explored in the HomeFinder application. However, instead of housing prices you will build an interactive visualizations for a dataset containing information about Bay Area Software Companies. Note that this data is fetched from the Google Places API in early October 2023, and it is not a comprehensive list of all software companies located in the San Francisco Bay Area.
Requirements
The data includes lat/lon locations for each software company along with other descriptive fields as noted below. There are 3500 software company locations all together in the dataset. Your goal is to show these software company data points on a map of the Bay Area and provide the following dynamic query functionality:
-
You must allow users to specify two draggable locations A (e.g. point of interest 1) and B (e.g. point of interest 2), as well as an adjustable radius for each one and filter the software companies to those that lie within the intersection of the circles around A and B. (Other software companies should be grayed out.) The locations of the circles should be draggable, and the circles can already be on the page upon loading. You may use either sliders or a draggable edge on the circles to adjust their radii. If you want to be fancy you may try letting users adjust the radii using either sliders or a draggable edge, but be careful, implementing both so that they update properly (i.e. the sliders update when you drag the edge and vice versa) is somewhat tricky.
-
When the user hovers over a software company location point, the name of the software company and its average rating (if not null) should be visible, and not visible otherwise.
-
You must provide at least 1 additional filtering controls that allow users to filter out specific aspects of the data (e.g. limit the average rating or number of user ratings to a range of values, limit to software companies with names starting with a specific letter, limit the location to a certain street name, etc.)
The application should update at interactive rates (0.1s update rate) and part of this assignment is to write the code so that the filters operate quickly.
You can work by yourself or with a partner for this assignment. Groups of three or more are not allowed. Your group must write code for this assignment. You are free to write the code in any programming language/environment you prefer, including JavaScript, C++, Java, etc. In addition you may use any software toolkit to help you build the code. However, we strongly recommend using JavaScript and D3 for this assignment. The teaching staff will provide support for coding the assignment using these tools either in Observable or as a standalone D3 application. We cannot guarantee that we can help you in other coding environments. We expect you to write the code from scratch, but if you use any pre-existing resources (e.g. Stack Overflow, extensively peruse related code on GitHub, etc.) we expect you to list them as part of your submission.
No matter what language/libraries you use we would like you to submit either an Observable notebook or a final executable program that we can execute on our own on either a Mac OS X or a Windows machine. Ideally, you should submit the work as a link to a website (e.g. an Observable notebook or a standalone webpage, such as one hosted through GitHub pages) where we can run your code along with the source code. If this is a problem for you, please talk to us right away.
Deliverables
Your final submission should include:
- A link to a published version of your Observable notebook or the bundled source code for your application uploaded as file (either a .zip or .tar.gz archive) to Canvas. If your code is designed to be run in a browser you must also provide a link to a live version on the web, Please ensure that the software submitted is in working order. If any special instructions are needed for building or running your software, please provide them.
- For submissions by groups of two, please also include a breakdown of how the work was split among the group members.
- We expect you to write the code from scratch, but if you use any pre-existing resources (e.g. Stack Overflow, extensively peruse related code on GitHub, etc.) we expect you to list them as part of your submission.
- Finally, please include a commentary on the development process, including answers to the following questions: Roughly how much time did you spend developing your application? What aspects took the most time?
Upload a link to a published version of your Observable notebook with an embedded write-up, or upload the bundled code and your write-up as a PDF, to Canvas. If you’re working in a group of two, please just have one person submit to Canvas, but make sure to include both group members’ names in your write up.
Your assignment must be posted to Canvas by Monday Oct 30, 2023 by 11:30am.
Software Company Locations Data
We have set up the Bay Area Software Companies dataset to contain 3500 rows with the following fields:
ID: A string describing the unique ID of the software company location given by the Google Places API.Name: A string describing the name of the software company location.Latitude: A float describing latitude of the software company location.Longitude: A float describing longitude of the software company location.Average_Rating: A float describing the average rating for the software company out of 5 (can be null if no users have rated the location).Number_User_Ratings: An integer representing number of users who have rated the software company location on Google Maps.Address: A string describing the street and city of the software company location.
This data is a subset of the locations on Google Maps categorized as “software company” in the Bay Area. We have obtained the data through the Google Places API.
Resources
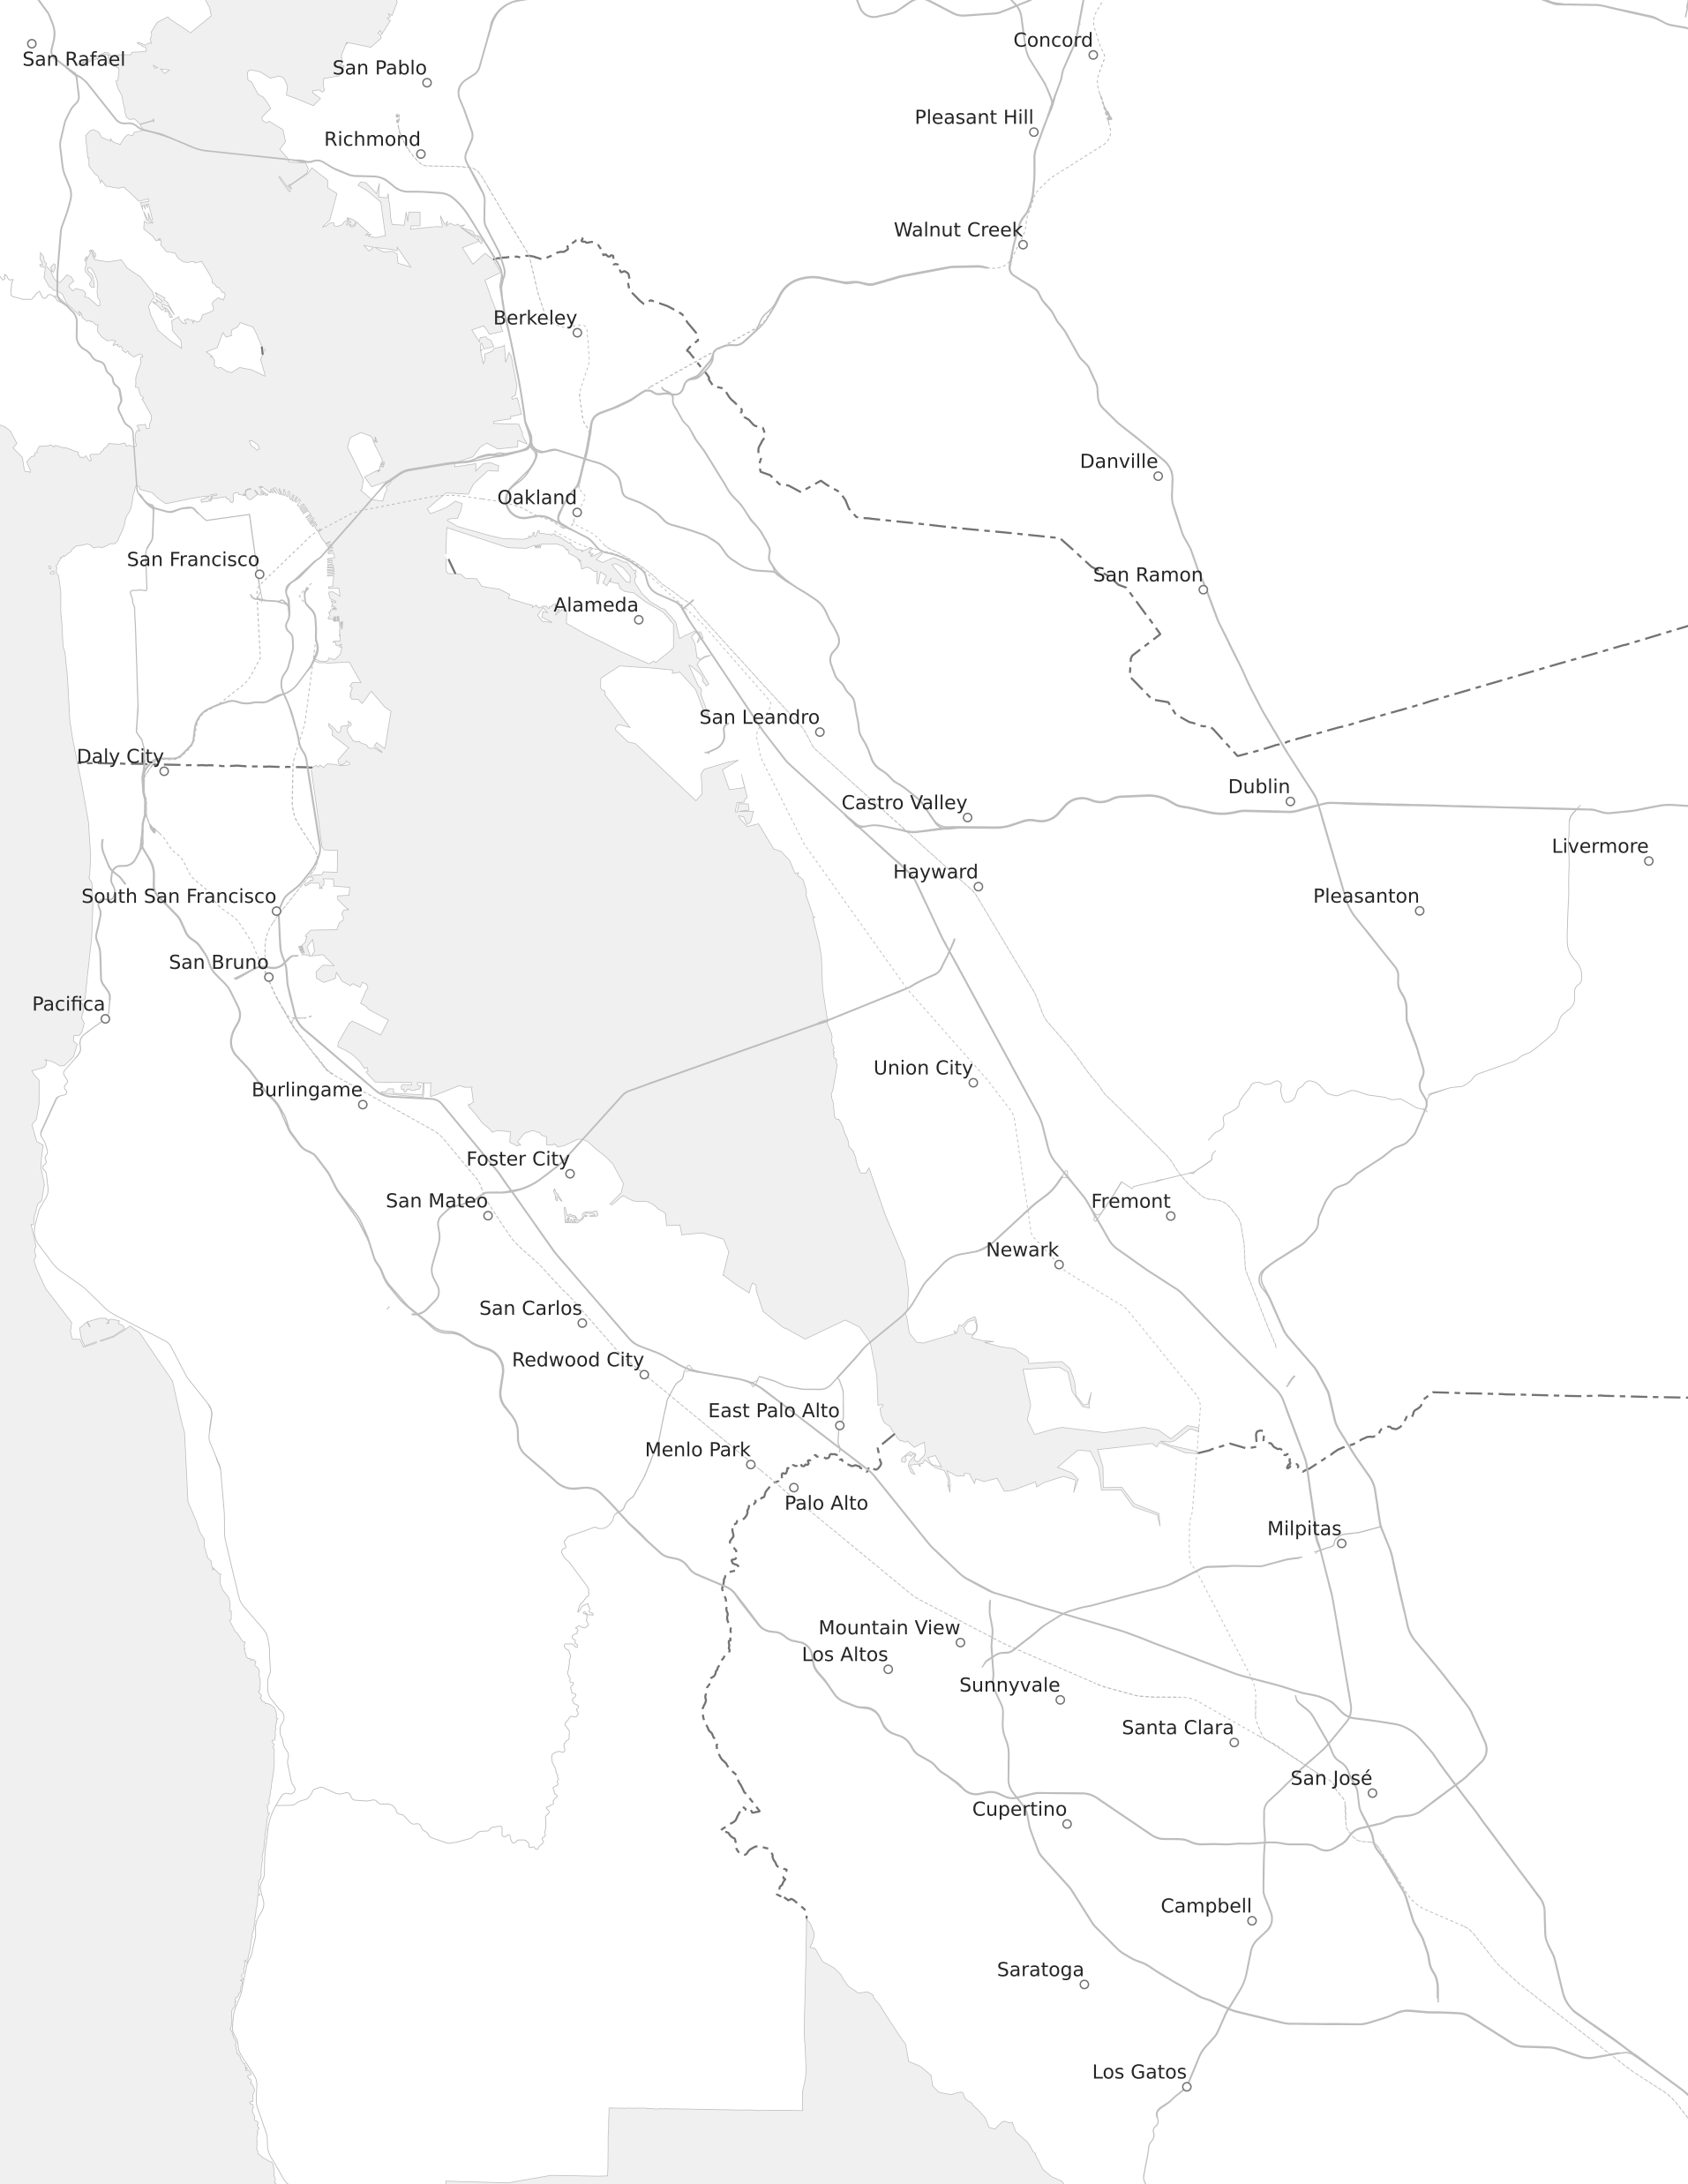
Map
You can use this PNG map of the region covered in the dataset as the base for your visualization. (You are also welcome to use a different strategy for mapping, but make sure we can see geographic detail comparable to the provided map.)
If you use the provided map, here’s a sample D3 snippet to set it up. You’ll need to adjust this depending on how you’re designing your visualization tool.
// Assumes you've included D3 version 7 somewhere above:
// e.g. <script src="https://d3js.org/d3.v7.min.js"></script>

// Set up size
var mapWidth = 620;
var mapHeight = 800;

// Set up projection that the map is using
var mapFrameGeoJSON = JSON.parse(`{"type":"Feature","geometry":{"type":"LineString","coordinates":[[-122.54644297642132,37.989209933976475],[-121.74157680240731,37.19360698897229]]}}`)
var projection = d3.geoConicConformal()
  .parallels([37 + 4 / 60, 38 + 26 / 60])
  .rotate([120 + 30 / 60], 0)
  .fitSize([mapWidth, mapHeight], mapFrameGeoJSON)

// This is the mapping between <longitude, latitude> position to <x, y> pixel position on the map
// projection is a function and it has an inverse:
// projection([lon, lat]) returns [x, y]
// projection.invert([x, y]) returns [lon, lat]
// The base map and the projection function is based on
//  this Observable notebook: https://observablehq.com/@clhenrick/sf-bay-area-basemap-cropped

// Add an SVG element to the DOM
var svg = d3.select('body').append('svg')
  .attr('width', mapWidth)
  .attr('height', mapHeight);

// Add the static PNG map at correct size, assuming map is saved in a subdirectory called `data`
svg.append('image')
  .attr('width', mapWidth)
  .attr('height', mapHeight)
  .attr('xlink:href', 'data/map.png');
Once you’ve run this code, projection is an instance of a D3 projection. If you pass it the longitude and latitude of a software company location, it will return an array [x, y], which is the pixel on your static map backdrop that matches to the longitude/latitude pair. E.g. if you had only one software company to draw with longitude business_longitude and latitude business_latitude, you might draw a point for it with something like:
var projectedLocation = projection([business_longitude, business_latitude]);
var circle = svg.append('circle')
  .attr('cx', projectedLocation[0])
  .attr('cy', projectedLocation[1])
  .attr('r', 1);
FAQ
How to respond to DOM events e.g. clicks?
Similar to jQuery, D3 provides a simple interface to add even listeners: use the on method on any selection. For example, to listen to click events on circles and print out the associated data object:
d3.selectAll('circle')
  .on('click', function(d) { console.log(d); });
Why is my data undefined?
You are most likely trying to use your data before it is ready/loaded. In JavaScript, HTTP requests are handled asynchronously. When you call d3.csv, the browser starts makes an HTTP request to that resource, and it immediately continues to execute the following code:
// In D3 v7, the csv function uses Promises instead of asynchronous callbacks to load data
d3.csv("file.csv").then(function(data) {
	console.log(data);
});

// This code is going to run before data is loaded, and you cannot use the data here
console.log('We don't have the data yet.');
nonDataRelatedStuff();

// This will print:
// => We don't have the data yet.
// => We have the data now!
How should I be doing my D3 development?
If you submit an Observable notebook link, we will be testing your visualizations by running the cells directly within the notebook itself, using the most recent stable version of Google Chrome.
If you submit bundled code, we’ll be testing your visualizations in the most recent stable version of Google Chrome (unless you come talk to us with a really good reason to do something differently for you), so use Chrome to develop. Chrome’s DevTools can be quite helpful as you work. Chrome also supports many ES6 and beyond features (const and let, arrow functions, async and await, etc.) so you’re welcome to use these if you’re familiar with them, but there’s definitely no need.
You might also need to run a local web server while you’re developing, because Chrome may fail to load data through d3.csv (or other XMLHttp Requests) for security reasons if you don’t. To do this, you can run python -m http.server from the directory where your code lives. (Your command line should give you a localhost link.) If that doesn’t work for you, come talk to us.
You can use GitHub Pages to host your web-based visualization software at no cost. As a student, you can upgrade your GitHub account to the Pro version for free by signing up for the Student Developer Pack. The Pro version allows you to keep private repos.
Other resources for learning D3 (and other web programming)
- Review the slides for 10/18 and 10/23 (These have some links to other resources in them too), and other links on the homepage of the website.
-
There are lots of D3 code samples on Observable, a website run by the creator of D3, Mike Bostock. You can definitely take a look at examples here (and on Stack Overflow, etc.) for learning techniques, but please be very transparent by citing any external code snippets that you adapt, or even ones that simply inspire how you do something. We expect your design choices and your implementation to be original.
-
When in doubt, refer to the D3 API documentation. It is dense in places, but very thorough.