Assignment 3: Creating Interactive Visualization Software
Due: Tuesday Oct 20, 2020 by 10:30am
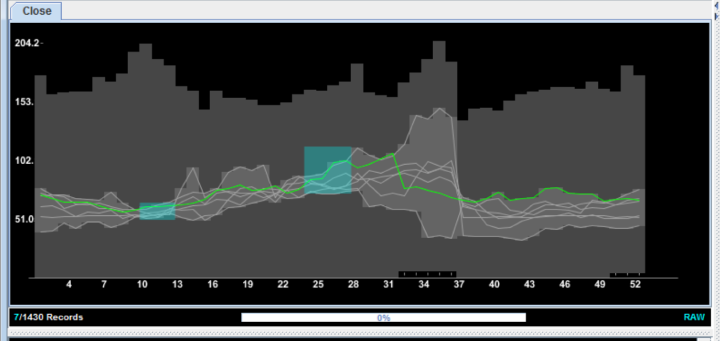
In this assignment, you will explore the issues involved in implementing interactive visualization software. Specifically we would like you to implement the interactive technique of dynamic queries – in the style of TimeSearcher. However, instead of stock prices you will build an interactive visualization for a data set containing containing information about the screentime for the top the top 100 public celebrities that appear on cable TV news over the last decade. The data set comes from the Stanford Cable TV News Analyzer project.
Requirements
The data set provides the monthly total screentime (in seconds) for each of the top 100 people appearing on one of the three main cable TV news channels (CNN, Fox News, MSNBC) in the US. Your goal is to visualize this time series data and provide the following dynamic query functionality.
-
You must create a line chart with one line for each person showing how their screentime varies from month to month across the ten years. That is the x-axis of your chart should range over the 10 years and the y-axis should present screentime in seconds. Each line should be labeled on the right side with name of the person it represents (don’t worry if many of the names overlap one another).
-
You must allow users to specify multiple timebox queries which filter the lines to those that pass all the way through all of the timeboxes (enter at the left edge and exit through the right edge of the timebox) placed in the chart. All lines that pass through filter should be highlighted.
-
You must allow users to drag, resize and remove timeboxes. Direct manipulation is a plus (e.g. directly dragging on the edges of a timebox), but is not required. Make sure to include a description of how users can interact with the timeboxes (e.g, adding text below the chart).
-
The lines should be filtered in real-time and the highlighted lines passing the through all the timeboxes should update as the timeboxes are resized, dragged or removed interactive rates (0.1s update rate). Part of this assignment is to write the code so that the filters operate quickly.
Optionally you may provide the following features for extra credit.
- You may provide 1 or more additional filtering controls that allow users to filter out specific names from the data set (i.e. you might allow removing people with surnames starting with a specific letter or range of letters, or you might allow users to search for specific names and highlight only those people). Note that such filters on the names should work in conjunction with the timeboxes so that lines have to pass all the filters to be highlighted. If you submit work for the extra credit, make sure to indicate that you have attempted the extra credit and to state how the controls can be interacted with if not obvious.
More details about timebox queries can be found in the original TimeSearcher paper.
You can work by yourself or with a partner for this assignment. Groups of three or more are not allowed. Your group must write code for this assignment. You are free to write the code in any programming language/environment you prefer, including JavaScript, C++, Java, etc. In addition you may use any software toolkit to help you build the code. However, we strongly recommend using JavaScript and D3 for this assignment. You may implement this assignment within Observable Notebooks however, we recommend that if you use Observable that you also build a standalone website version as it is useful to make sure you know how to develop D3 code that runs outside of Observable. This may be especially useful for your final project.
We expect you to write the code from scratch, but if you use any pre-existing resources (e.g. Stack Overflow, extensively peruse related code on github, etc.) we expect you to list them as part of your submission.
No matter what language/libraries you use we would like you to submit a final executable program that we can execute on our own on either a Mac OS X or a Windows machine. Ideally the you should submit the work as pointer to a website where we can run your code along with the source code. If this is a problem for you, please talk to us right away.
A number of tools for creating visualizations without programming are also available (Tableau for example). While you are free to use them to explore your data set and try out design ideas, you must program the final application yourself. If you have any questions about the status of a given tool, please ask us.
Deliverables
Your final submission should include:
- The bundled source code for your application, uploaded as file (either a .zip or .tar.gz archive) to Canvas. (You may also provide a link to a live version on the web, but this is not required. The bundled code is.) Please ensure that the software submitted is in working order. If any special instructions are needed for building or running your software, please provide them.
- For submissions by groups of two, please also include a breakdown of how the work was split among the group members.
- We expect you to write the code from scratch, but if you use any pre-existing resources (e.g. Stack Overflow, extensively peruse related code on github, etc.) we expect you to list them as part of your submission.
- Finally, please include a commentary on the development process, including answers to the following questions: Roughly how much time did you spend developing your application? What aspects took the most time?
Upload the bundled code and your write-up, as a PDF, to Canvas. If you’re working in a group of two, please just have one person submit to Canvas, but make sure to include both group members’ names in your writeup.
Your assignment must be posted to Canvas by Tuesday Oct 20, 2020 by 10:30am.
Top 100 Personalities on Cable TV News Data
We have set up the top 100 cable TV News personalities data set to contain 12700 rows with the following fields:
person: A string containing the name of the personality.year_month: The year-month starting from 2010-01 and running through 2020-07.screen_time_seconds: Time in seconds the person was on either CNN, Fox News or MSNBC each month.
The data set is a portion of the data available through the Stanford Cable
TV News Analyzer project.
We filtered and cleaned the data from this site to ensure that each
person listed in the data set has a complete record from 2010-01
through 2020-07. If they did not appear on screen the data set reports
0 screen_time_seconds for the month.
Resources
FAQ
How should I be doing my D3 development?
We’ll be testing your visualizations in the most recent stable version
of Google Chrome (unless you come talk to us with a really good reason
to do something differently for you), so use Chrome to
develop. Chrome’s
DevTools
can be quite helpful as you work. Chrome also supports many ES6 and
beyond features (const
and let, arrow functions, async and await, etc.) so you’re
welcome to use these if you’re familiar with them, but there’s
definitely no need.
You may also want to run a local web server while you’re developing,
because Chrome may fail to load data through d3.csv (or other
XMLHttp Requests) for security reasons if you don’t. Running python3
-m http.server from the directory where your code lives is one
easy way to do this. (Your command line should give you a localhost
link.) If that doesn’t work for you, talk to us.
How should I approach this assignment?
We suggest that you think of the assignment as having two major components: (1) using the provided data to draw a line chart and (2) adding the interactive timeboxes.
Some examples you can look at for drawing line charts: Simple line chart, Multi-line chart, Index chart.
Although there could be other approaches for adding the interactive timeboxes,
we suggest either (1) building the timeboxes from elementary elements such as rects or paths,
or (2) significantly extending D3 brush (Example of code using brush) to support multiple brushes.
If you go with the former approach, you will need to manage each component of the timeboxes, but will have control over all components of the timebox (e.g, can freely add, modify mouse events).
If you go with the latter approach, D3 brush will do most of the component mangagement for you, but you will have to have a good understanding of how brush operates and will not be able to make modifications to the components as easily (e.g, adding new mouse events could be tricky).
I am following sample code from the web and it does not run.
As you search through the web for examples and code snippets, check for the version of D3 the code was written for. Because some of the previous updates changed the names and locations for many of the functions, code written for older versions may not run as expected. If you are looking at code written for older versions of D3, make sure that the functions you intend to use are either still supported in the current version (Version 6) or look for their equivalents.
My code in a Observable notebook does not run with browser JavaScript. (If you are making a standalone webpage)
If you are making a standalone webpage to runwith browser Javascript, be aware that Observable offers many features not present in vanilla Javascript, and you may have to modify your code if you are using the Observable-specific features.
Other resources for learning D3 (and other web programming)
-
Review the slides and notebooks for 10/6 and 10/8 (These have some links to other resources in them too), and other links on the homepage of the website.
-
MOOC: Information Visualization: Programming with D3.js, you can audit it for free! It covers HTML/CSS/JS/D3 basics in a few hours.
-
There are lots of D3 code samples on D3 Gallery and bl.ocks.org, both websites run by the creator of D3, Mike Bostock. You can definitely take a look at examples here (and on Stack Overflow, etc.) for learning techniques, but please be very transparent by citing any external code snippets that you adapt, or even ones that simply inspire how you do something. We expect your design choices and your implementation to be original.
-
When in doubt, refer to the D3 API documentation. It is dense in places, but very thorough.