Assignment 3: Creating Interactive Visualization Software
Due: Monday Oct 30, 2017 by 4:30pm (before class)
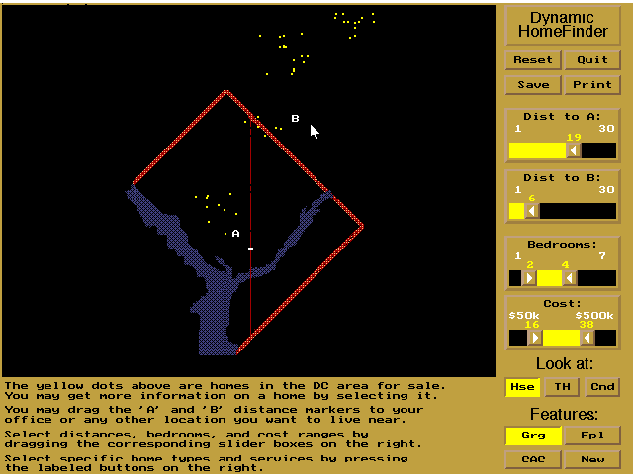
In this assignment, you will explore the issues involved in implementing interactive visualization software. Specifically we would like you to implement the interactive technique of dynamic queries – first explored in the HomeFinder application. However, instead of housing prices you will build an interactive visualizations for a dataset containing the information about 9,831 trees located in San Francisco.
Requirements
The data includes lon/lat locations for each tree along with other descriptive fields as noted below. Your goal is to show these tree data points on a map of San Francisco and provide the following dynamic query functionality:
-
You must allow users to specify two locations A (e.g. point of interest 1) and B (e.g. point of interest 2), as well as a radius for each one and filter the trees to only those that lie within the intersection of the circles around A and B.
-
You must provide at least 1 additional filtering controls that allow users to filter out specific aspects of the data (e.g. limit the species type of the tree, limit to a particular tree diameter at breast height, etc.)
The application should ideally update at interactive rates (0.1s update rate) and part of this assignment is to write the code so that the filters operate quickly.
You can work by yourself or with a partner for this assignment. Groups of three or more are not allowed. Your group must write code for this assignment. You are free to write the code in any programming language/environment you prefer, including Javascript, C++, Java, etc. In addition you may use any software toolkit to help you build the code. However, we strongly recommend using Javascript and D3 for this assignment. We expect you to write the code from scratch, but if you use any pre-existing resources (e.g. Stack Overflow, extensively peruse related code on github, etc.) we expect you to list them as part of your submission.
No matter what language/libraries you use we would like you to submit a final executable program that we can execute on our own on either a Mac Os X or a Windows machine. Ideally the you should submit the work as pointer to a website where we can run your code along with the source code. If this is a problem for you, please talk to us right away.
A number of tools for creating visualizations without programming are also available (Tableau for example). While you are free to use them to explore your data set and try out design ideas, you must program the final application yourself. If you have any questions about the status of a given tool, please ask us.
Deliverables
Your final submission should include:
- A brief written description of your final interactive visualization application.
- The bundled source code for your application, uploaded as file (either a .zip or .tar.gz archive) to Canvas. (You may also provide a link to a live version on the web, but this is not required. The bundled code is.) Please ensure that the software submitted is in working order. If any special instructions are needed for building or running your software, please provide them.
- For submissions by groups of two, please also include a breakdown of how the work was split among the group members.
- We expect you to write the code from scratch, but if you use any pre-existing resources (e.g. Stack Overflow, extensively peruse related code on github, etc.) we expect you to list them as part of your submission.
- Finally, please include a commentary on the development process, including answers to the following questions: Roughly how much time did you spend developing your application? What aspects took the most time?
Upload the bundled code and your write-up, as a PDF, to Canvas. If you’re working in a group of two, please just have one person submit to Canvas, but make sure to include both group members’ names in your writeup.
Your assignment must be posted to Canvas before class on October 30, 2017.
Trees Data
We have filtered the trees.csv dataset to contain 9,831 rows with the following fields:
TreeID: A unique integer for each tree.qSpecies: A string describing the species of the tree (generally includes a scientific and common name, e.g.Tristaniopsis laurina :: Swamp Myrtle). Beware that not all of these are well-formed. (Some rows sayTree(s) ::or just::.)qAddress: A string describing the rough address where the tree is located. Can be precise (974 Market St) or describing an rough area (400X Junipero Serra Blvd). A couple are empty strings.qSiteInfo: A string describing the type of location where the tree has been planted (e.g.Sidewalk: Curb side : Cutout).DBH: Diameter at breast height in inches. Integer, but some are null/empty strings.PlotSize: A string describing the size of the plot where the tree is planted. No unified schema:3x3and3X3andWidth 3ftall appear. Some are empty strings.Latitude: Float describing latitude of tree. Some are null/emtpy string.Longitude: Float describing longitude of tree. Some are null/emtpy string.
This data is a subset of a more complete San Francisco tree dataset. You can download a CSV for that one here (~46 MB).
The trees.csv dataset required for this assignment filters the full
dataset to only include trees maintained by the San Francisco
Department of Public Works. If there are multiple trees at a single
site, it only includes one of them. (qLegalStatus === 'DPW
Maintained' and SiteOrder === 1) Therefore the distribution of
species, diameters, etc. may not be representative of the whole
population of trees in San Francisco! The full data also includes more
columns, like notes on some trees’ permitting and the dates when some
trees were planted.
Once you have built your visualization tool, you can try substituting in the complete dataset.
Resources
Map
You can use this SVG map of San Francisco as the base for your visualization. (You’re also welcome to use a different strategy for mapping, but make sure we can see geographic detail comparable to the provided map.)
If you use the provided map, here’s a sample D3 snippet to set it up. You’ll need to adjust this depending on how you’re designing your visualization tool.
// Assumes you've included D3 version 4 somewhere above:
// e.g. <script src="https://d3js.org/d3.v4.min.js"></script>

// Set up size
var mapWidth = 750;
var mapHeight = 750;

// Set up projection that the map is using
var projection = d3.geoMercator()
  .center([-122.433701, 37.767683]) // San Francisco, roughly
  .scale(225000)
  .translate([mapWidth / 2, mapHeight / 2]);

// This is the mapping between <longitude, latitude> position to <x, y> pixel position on the map
// projection is a function and it has an inverse:
// projection([lon, lat]) returns [x, y]
// projection.invert([x, y]) returns [lon, lat]

// Add an SVG element to the DOM
var svg = d3.select('body').append('svg')
  .attr('width', mapWidth)
  .attr('height', mapHeight);

// Add SVG map at correct size, assuming map is saved in a subdirectory called `data`
svg.append('image')
  .attr('width', mapWidth)
  .attr('height', mapHeight)
  .attr('xlink:href', 'data/sf-map.svg');
Once you’ve run this code, projection is an instance of a D3 projection. If you pass it the longitude and latitude of a tree, it will return an array [x, y], which is the pixel on your SVG backdrop that matches to the longitude/latitude pair. E.g. if you had only one tree to draw with longitude treeLon and latitude treeLat, you might draw a point for it with something like:
var projectedLocation = projection([treeLon, treeLat]);
var circle = svg.append('circle')
  .attr('cx', projectedLocation[0])
  .attr('cy', projectedLocaiton[1])
  .attr('r', 1);
FAQ
How to respond to DOM events e.g. clicks?
Similar to jQuery, D3 provides a simple interface to add even listeners: use the on method on any selection. For example, to listen to click events on circles and print out the associated data object:
d3.selectAll('circle')
  .on('click', function(d) { console.log(d); });
Why is my data undefined?
You are most likely trying to use your data before it is ready/loaded. In JavaScript, HTTP requests are handled asynchronously. When you call d3.csv, the browser starts makes an HTTP request to that resource, and it immediately continues to execute the following code:
d3.csv(url, function(error, data) {
  // This function gets called when the request is resolved (either failed or succeeded)
  console.log('We have the data now!');

  if (error) {
    // Handle error if there is any
    return console.warn(error);
  }

  // If there is no error, then data is actually ready to use
  visualize(data);
});

// This code is going to run before data is loaded, and you cannot use the data here
console.log('We don't have the data yet.');
nonDataRelatedStuff();

// This will print:
// => We don't have the data yet.
// => We have the data now!
How should I be doing my D3 development?
We’ll be testing your visualizations in the most recent stable version of Google Chrome (unless you come talk to us with a really good reason to do something differently for you), so use Chrome to develop. Chrome’s DevTools can be quite helpful as you work. Chrome also supports many ES6 and beyond features (const and let, arrow funcitons, async and await, etc.) so you’re welcome to use these if you’re familiar with them, but there’s definitely no need.
You should also be running a local web server while you’re developing, because Chrome may fail to load data through d3.csv (or other XMLHttp Requests) for security reasons if you don’t. Running python -m SimpleHTTPServer from the directory where your code lives is one easy way to do this. (Your command line should give you a localhost link.) If that doesn’t work for you, come talk to Alec or Zach.
Other resources for learning D3 (and other web programming)
- Review the slides for 10/18 and 10/23 (These have some links to other resources in them too), and other links on the homepage of the website.
- We’ve listed some other tutorials and resources in this Piazza thread. We’ll try to add more here as we find new ones that are really great. Please post stuff you find here too!
- We’ll be having extra office hours. Keep an eye on Piazza for these.
- There are lots of D3 code samples on bl.ocks.org, a website run by the creator of D3, Mike Bostock. You can definitely take a look at examples here (and on Stack Overflow, etc.) for learning techniques, but please be very transparent by citing any external code snippets that you adapt, or even ones that simply inspire how you do something. We expect your design choices and your implementation to be original.
- When in doubt, refer to the D3 API documentation. It is dense in places, but very thorough.