Well designed visualizations capitalize on human facilities for processing visual information and thereby improve comprehension, memory, inference, and decision making. In this course we will study techniques and algorithms for creating effective visualizations based on principles from graphic design, visual art, perceptual psychology and cognitive science. The course is targeted both towards students interested in using visualization in their own work, as well as students interested in building better visualization tools and systems.
There are no official prerequisites for the class, but familiarity with the material in CS147, CS148 and CS142 is especially useful. Most important is a basic working knowledge of, or willingness to learn, web-programming, especially JavaScript, Vega-Lite and D3.js. While we will cover a little bit of Vega-Lite and D3.js in class, we will also expect students learn some introductory material, especially about Javscript on their own, as necessary. Tutorials on Javascript are available on the web and we will help you find the relevant information as you need it.
*Contact us via Slack if you are worried about whether you have the background for the course.
Learning Goals
The goals of this course are to provide students with the foundations necessary for understanding and extending the current state of the art in visualization. By the end of the course, students will have:
- An understanding of key visualization techniques and theory, including data models, graphical perception and methods for visual encoding and interaction.
- Exposure to a number of common data domains and corresponding analysis tasks, including exploratory data analysis and network analysis.
- Practical experience building and evaluating visualization systems using Vega-Lite and D3.js.
- The ability to read and discuss research papers from the visualization literature.
Textbooks/Resources
- The Visual Display of Quantitative Information (2nd Edition). E. Tufte. Graphics Press.
- Envisioning Information. E. Tufte. Graphics Press.
- Optional Textbook. Visualization Analysis and Design. Tamara Munzner. A K Peters Visualization Series. CRC Press.
- Optional Reference. Interactive Data Visualization for the Web (2nd Edition). Scott Murray. O’Reilly Press. [Read Online] [Code Examples on Github]
Your best bet is to order them online. Please order soon. Readings will be assigned in the first week of class.
Schedule
Chapter 1: Information Visualization, In Readings in Information Visualization. Card, et al. (pdf)
Decision to launch the Challenger, In Visual Explanations. Tufte. (pdf)
Representation and Misrepresentation. (Critique of Tufte's analysis). Boisjoly et al. (web)
Graphs in Statistical Analysis. F. J. Anscombe. The American Statistician. (jstor)
Chapter 1: Graphical Excellence, In The Visual Display of Quantitative Information. Tufte.
Chapter 2: Graphical Integrity, In The Visual Display of Quantitative Information. Tufte.
Chapter 3: Sources of Graphical Integrity. In VDQI. Tufte.
Level of Measurement. (Wikipedia)
On the theory of scales of measurement. Stevens. (jstor)
Design and Redesign in Data Visualization. Viegas and Wattenberg. (web)
The Power of Representation. Chapter 3 In Things that Make Us Smart. Norman. (pdf)
Chapter 4: Data-Ink and Graphical Redesign. In VDQI. Tufte.
Chapter 5: Chartjunk. In VDQI. Tufte.
Chapter 6: Data Ink Maximization and Graphical Design. In VDQI. Tufte.
The representation of numbers. Zhang and Norman. (pdf)
Vega-Lite Excercise (will use in class) (JavaScript/Observable)
Graphical Methods for Data Presentation. Cleveland. (jstor)
Chapter 8: Data Density and Small Multiples. In VDQI. Tufte.
Chapter 2: Macro/Micro Readings. In Envisioning Information. Tufte.
Chapter 4: Small Multiples. In Envisioning Information. Tufte.
The death of interactive infographics? Baur. 2017 (web)
In Defense of Interactive Graphics. Aisch. 2017 (web)
Dynamic queries, starfield displays, and the path to Spotfire. Shneiderman. (web)
Visual queries for finding patterns in time series data, Hochheiser and Schneiderman. (pdf)
Postmortem of an example, Bertin. (pdf)
Classic systems from stat-graphics.org (videos)
Let's Make a Scatterplot (will use in class) (JavaScript/Observable)
Observable D3 gallery (html)
Mike Bostock's notebooks for learning D3 (html)
Interactive Data Visualization for the Web. 2nd Ed., Scott Murray. Chapters 4, 5, 6. (html)
D3: Data Driven Documents. Bostock et al. (pdf)
Making D3 Charts Interactive (Javascript/Observable)
Let's Make a Scatterplot (will use in class) (Javascript/Observable)
D3 Exercises (will use in class) (Javascript/Observable)
Interactive Data Visualization for the Web. 2nd Ed. Scott Murray. Chapters 7, 8, 9. (html)
Perception in visualization. Healey. (html)
Graphical perception. Cleveland and McGill. (jstor)
Chapter 3: Layering and Separation. In Envisioning Information. Tufte.
Gestalt and composition. In Course #13, SIGGRAPH 2002. Durand. (pdf)
The psychophysics of sensory function. Stevens. (jstor)
Crowdsourcing Graphical Perception. Heer and Bostock. ACM CHI 2010. (pdf)
The Pudding (read through at least 3 articles in detail) (html)
Design for an Audience, Corum. (html)
Narrative Visualization: Telling Stories with Data, Segel and Heer. (pdf)
Communicating with Interactive Articles. Hohman, Conlen, Heer and Chau. (html)
Ice World: Visualizing Science at the New York Times, Corum. (html)
Color and information, In Envisioning Information, Tufte.
Color Naming Models for Color Selection, Image Editing and Palette Design. Heer and Stone. (html)
Color guidelines, Brewer. (html)
The crayola-fication of the world. Bhatia. (html)
A rule-based system for assisting color map selection, Bergman, Treinish and Rogowitz. (pdf)
Charting color from the eye of the beholder. Landa, Fairchild. (pdf)
Color2Gray: Salience-preserving color removal. Gooch, Olsen, Tumblin, Gooch. (pdf)
ColorBrewer2
Bruce Lindbloom’s Useful color information, studies, and files
Meet iCam: A Next-Generation Color Appearance Model
Animated Transitions in Statistical Data Graphics. Heer and Robertson. (html)
Animation: Can it facilitate? Tversky, Morrison and Betrancourt. (pdf)
Principles of Traditional Animation Applied to Computer Animation. Lasseter. (acm)
Intuitive Physics. McCloskey. (pdf)
Representing motion in a static image. Cutting. (pdf)
Graph Visualization: A Survey. Herman, Melancon and Marshall. (pdf)
Hierarchical Edge Bundles. Holten. (ieee)
Let’s draw a graph. Khoury. (html)
Visual Exploration of Multivariate Graphs. Wattenberg. (pdf)
Improving Walker’s Algorithm to Run in Linear Time. Buchheim, Jünger and Leipert. (pdf)
Dig-cola. Dwyer and Koren. (pdf)
A Technique for Drawing Directed Graphs. Gansner, Koutsofios, North and Vo. (pdf)
Centrality and Prestige of Social Network Analysis. (pp. 169-198) Wasserman and Faust. (pdf)
Balancing Systematic and Flexible Exploration of Social Networks. Perrer and Shneiderman. (pdf)
The Structure and Function of Complex Networks (Sections 1 and 2 only pp. 1-8). Newman. (pdf)
The Social Organization of Conspiracy. Baker and Faulkner. (pdf)
Revision: Automated Classification, Analysis and Redesign of Chart Images.Savva et al. (html)
Graphical Overlays: Using Layered Elements to Aid Chart Reading. Kong and Agrawala. (html)
Deconstructing and Restyling D3 Visualizations. Harper and Agrawala (html)
Extracting References Between Text and Charts via Crowdsourcing. Kong et al. (html)
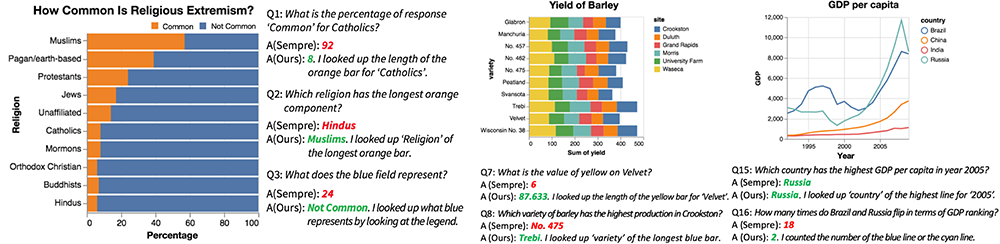
Answering Questions about Charts and Generating Visual Explanations. Kim et al. (html)
Towards Understanding How Readers Integrate Charts and Captions. Kim et al. (html)
Eviza: A Natural Language Interface for Visual Analysis, Setlur et al. (html)
Accessible Visualization via Natural Language Descriptions. Lundgard et al. (pdf)
The What-If Tool: Interactive Probing of Machine Learning models. Wexler et al. (arXiv)
Errudite: Scalable, Reproducible, and Testable Error Analysis. Wu et al. (html)
Rulematrix: Visualizing and understanding classifiers with rules. Ming et al. (html)
Coping with Imperfect Algorithms During Medical Decision Making Cai et al. (arXiv)
Mapping Text with Phrase Nets. van Ham, Wattenberg and Viégas. 2009 (pdf)
Ch. 11: Info. Vis. for Text Analysis. In Search User Interfaces. Hearst 2009. (html)
Ch. 10: Info. Vis. for Search Interfaces. In Search User Interfaces. Hearst 2009. (html)
Designing Model-Driven Visualizations for Text Analysis. Chuang et al. 2012 (html)
Termite: Visualization Techniques for Assessing Textual Topic Models. Chuang et al., 2012. (html)
Teaching Staff
Instructor: Maneesh Agrawala
Office Hours: 2-3:00pm Wednesdays, Coupa Cafe at Y2E2 and via Canvas/Zoom.
Course Assistant Dae Hyun Kim
Office Hours: 10-11:00am Thursdays, Outside of CEMEX Aud. at the GSB and via Canvas/Zoom.
Course Assistant Shana E. Hadi
Office Hours: 7-8:00pm Sundays, Canvas/Zoom.
We are also happy to meet by appointment. To contact us for any reason, please use Slack. This is the fastest way to get a response.
Assignments and Requirements
Class Participation (10%)
Assignment 1: Visualization Design (10%)
Assignment 2: Exploratory Data Analysis (15%)
Assignment 3: Creating Interactive Visualization Software (25%)
Final Project (40%)
Late Policy: We will deduct 10% for each day an assignment is late.
Plagiarism Policy: Assignments should consist primarily of your original work, building off of others’ work–including 3rd party libraries, public source code examples, and design ideas–is acceptable and in most cases encouraged. However, failure to cite such sources will result in score deductions proportional to the severity of the oversight.